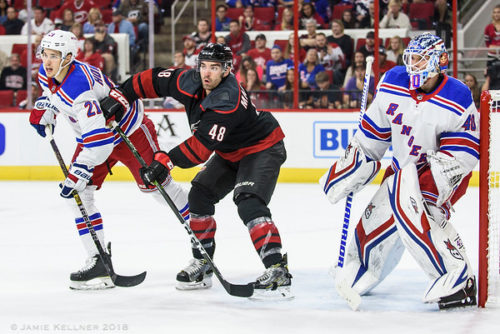
After being near the bottom of the league in goal scoring early in the season and middle of the pack for goals allowed, the Hurricanes have not surprisingly risen up the rankings during the team’s 2019 winning run.
The Canes are now averaging an even 3.00 goals scored per game which is good for a respectable 13th in the NHL and are averaging 2.74 goals against which is good for 6th in the NHL. Both are up significantly from the first half of the year and also from the 2017-18 season.
Today’s Daily Cup of Joe looks at the goal scoring side to determine what is driving the improvement.
Top 6 forwards
Who exactly is in the top 6 can vary a bit over the course of the season, but for this analysis I used Sebastian Aho, Teuvo Teravainen, Justin Williams and Jordan Staal for both years. Then for 2017-18 I added in Elias Lindholm and Jeff Skinner, and for 2018-19 I added in Micheal Ferland and Nino Niederreiter. To adjust for games played and injuries, I will use goals per game as a metric.
In 2017-18, the top 6 forwards averaged 21.5 goals per player per 82 games.
In 2018-19, that total is 25.7 goals per player per 82 games.
In total, the difference if all top 6 forwards played 82 games in each year would be a significant +25 goals.
Bottom 6 forwards
Math for the bottom 6 forwards simply includes all other forward scoring. Again, this is imperfect but still a reasonable approximation of scoring for the rest of the roster.
In 2017-18, the bottom 6 forwards averaged 10.7 goals per 82 games.
In 2018-19 the bottom 6 forwards have averaged 11.3 goals per player per 82 games.
Projected over a full season, the increase in scoring for the bottom 6 forwards projects to a modest 4 goals.
Interestingly, though the eye test seems to suggest that the bottom portion of the roster is contributing more offensively, that is not the case at least in terms of a simple measurement of goals scored per game. I think there still is a strong case to be made for the Canes depth forward lines being better, but that is more a function of fewer goals allowed/goal differential than raw scoring.
Defensemen
The scoring averages for defensemen simply include all games played by any defensemen.
In 2017-18, the Hurricanes blue line averaged 5.5 goals per player per 82 games.
In 2018-19, the blue line is averaging 7.1 goals per player per 82 games.
The difference over a full 82-game season projects to 10 additional goals in 2018-19.
Netting it out
By percentage, 64.1 percent of the Hurricanes increased scoring comes from the top 6 forwards, 25.6 percent comes from the defensemen and the remaining 10.3 percent comes from the bottom 6 forwards.
Put another way, the Hurricanes increased scoring is more than anything a function of the team’s top scorers finding a higher gear in 2018-19. The team’s top three goal scorers (Aho, Teravainen and Williams) have already matched the 68 goals that they scored in 2017-18 despite being only 69 games into the 2018-19 season. Ferland and Niederreiter have played fewer games but on a per game basis are better than Lindholm and Skinner from 2017-18. Only Jordan Staal is scoring at a slower pace.
The team’s bottom 6 forwards have scored more in 2018-19 but the difference is modest and not a driver for the team’s significant scoring gains.
The blue line’s 29 percent increase in goal scoring is significant enough to make a sizable contribution scoring-wise despite being a smaller portion of the total.
What say you Canes fans?
1) Does the split in terms of goal scoring gains for 2018-19 surprise you or match your expectations?
2) What do you make of the depth forwards seemingly being better in 2018-19, but that not really showing up in terms of goal scoring?
3) To what degree would you credit the top 6 scoring surge to Sebastian Aho playing at a higher level in his third NHL season?
Go Canes!


I think the simple explanation is that most of their offensive improvement is due to Aho. As different players have rotated onto his line, they’ve all scored goals at a higher rate.
It would be interesting to do this same exercise in reverse – where has been the improvement in reducing goals allowed by forwards? It FEELS like the bottom six is not a defensive liability.
1. Agree that Aho has increased the production of Ferland and Niederreiter–as he would have if Lindholm had been his RW.
2. Two things about the bottom six scoring. The third line is slightly less productive because Ryan/Rask/McGinn all had double-digit goals. However, both Ryan and Rask were regulars on the power play. Only Svechnikov gets any power play time. The top 6 and D are benefitting from a slightly better power play. The stark uptick in fourth line scoring is impressive since McKegg and Maenalanen joined the team. In a combined 59 games that duo has 10 goals–one less than Nordstrom/Kruger/Jooris/DiGuiseppe scored in 203 combined games in 17/18.
Almost all of the increase in scoring has come since the calendar turned to 2019. The addition of Niederreiter, McKegg, and Maenalanen has made the Canes more productive.
What does the bottom 6 scoring look like since Jan 1st?
I suspect that we’ll see a pretty noticeable uptake.
ct and breezy have it right. I think if you “annualize” bottom-6 scoring since since 12/31 you will find the eye-test conforms quite nicely.
Here’s wishing you a speedy recovery from tomorrow’s surgery.